The Lost Art of the Wyckoff Horizontal Count
Most traders project price targets using Fibonacci extensions, pivot points, or moving averages. These tools calculate future targets based on a vertical price swing that has already occurred, ignoring the actual energy built during the preceding consolidation.
Richard Wyckoff solved this problem with a simple, mechanics-first principle: Cause and Effect.
If a market spends months consolidating inside a trading range, it is building a cause. The subsequent trend is the effect, and its size is proportional to that cause. To project the exact magnitude of that effect, Wyckoff used a unique mapping tool called the horizontal Point & Figure (P&F) count.
Here is how the mechanism works, and how to apply it to your charts today.
Why range width predicts trend length
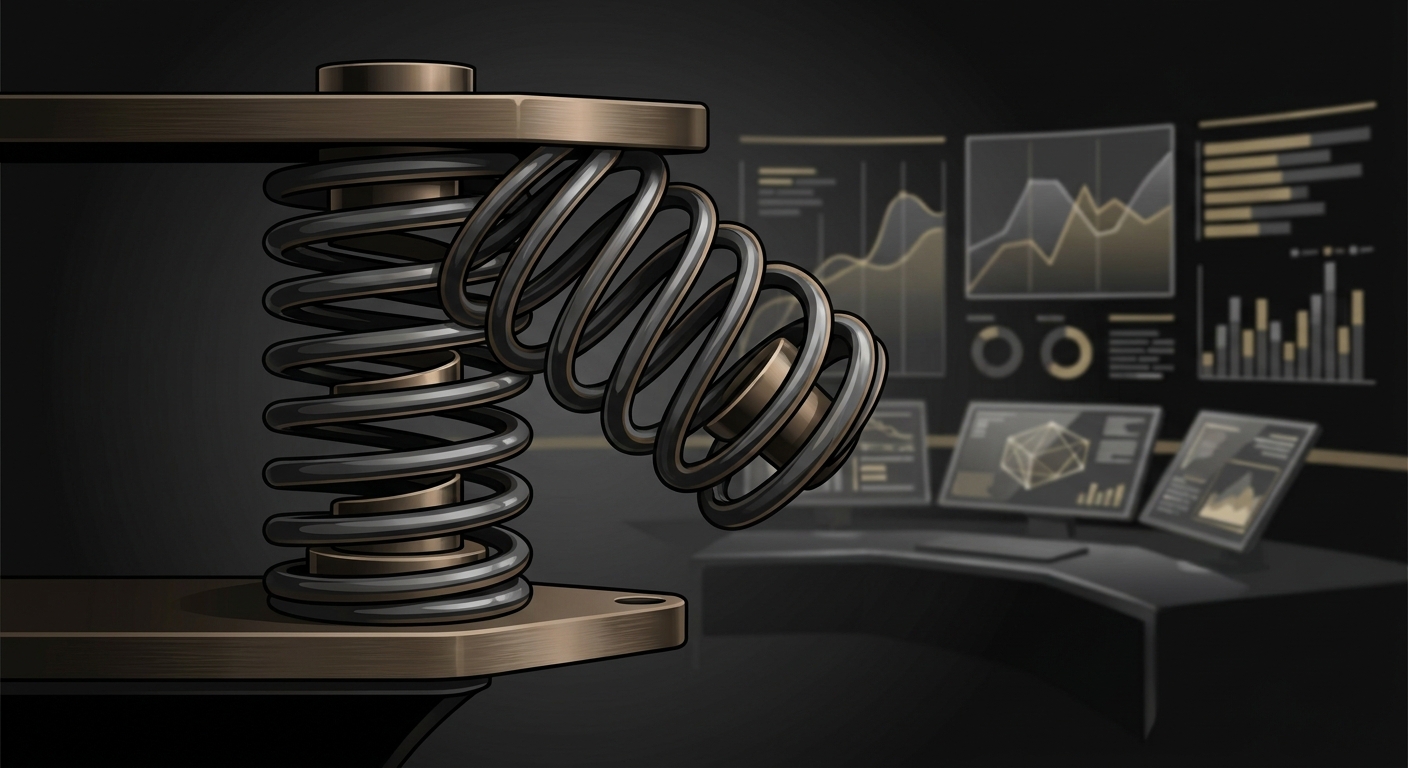
In classical mechanics, a spring compressed with great force travels further than one compressed lightly. In the market, a trading range acts as a compressed spring.
When institutional buyers accumulate shares inside a range, they do so slowly to avoid spiking the price. They absorb the circulating supply column by column, building a base. The wider this horizontal base, the larger the supply imbalance when price finally breaks out.
Point & Figure charts strip away the noise of time, focusing entirely on price movement and volume transactions. By counting the horizontal width of this consolidation base, you measure the physical cause. This allows you to project the objective effect with mathematical precision.
The Mechanics: How to build the count
To calculate a target, Wyckoff traders ignore the vertical height of the range and measure its horizontal width.
Follow these four steps to build your own projection:
1. Identify the Count Line
The count line is a representative horizontal row of price congestion inside the trading range. Look for the row that contains the highest number of occupied columns. This is where the most substantial transaction volume occurred, the zone where the Composite Operator did the heaviest accumulation.
2. Count the Columns
Count the number of occupied columns along that selected line. Measure from the left boundary (the Preliminary Support or Selling Climax) to the right boundary (the Last Point of Support or the Spring test).
3. Calculate the Increment
Multiply your horizontal count by the parameters of your chart.
$$\text{Target Increment} = \text{Columns} \times \text{Box Size} \times \text{Reversal Price Value}$$
For example, consider a standard 3-box reversal chart where each box represents $1. If your count line spans 15 columns, the calculation is 15 columns multiplied by $1 box size multiplied by a 3-box reversal, which yields a $45 target increment.
4. Establish the Target Band
To avoid relying on a single, rigid price, Wyckoff traders project a conservative-to-objective target band.
- The Conservative Target: Add the increment to the midpoint between the range low and the count line.
- The Objective Target: Add the increment directly to the exact low of the range, usually the lowest point of the Spring.
If your range low was $100, your midpoint was $110, and your target increment is $45, your target band is $145 to $155. For distribution ranges, you simply subtract the increment from the range high and midpoint.
The Rule of the Target: A zone, not a promise
A common trap is treating a P&F target as a guaranteed spot to short the asset or close a position blindly.
P&F targets are "stop, look, and listen" zones. They tell you where the market has exhausted the fuel built during the range. When price enters your target band, zoom in on the standard candlestick chart. Look for stopping volume, narrow spreads, and heavy effort failing to produce further upward result.
If supply expands inside the band, the cause has played out. If price consolidates on collapsed volume inside the band, the market may be building a "stepping stone" range to accumulate more fuel for a higher run.
Make Your Ranges Measurable
Before putting capital at risk on a breakout, look at the consolidation that preceded it. Did the range build enough cause to justify a 3:1 reward-to-risk ratio relative to your invalidation level? If the horizontal count projects a target band that barely clears overhead resistance, the trade fails the mechanical filter.
Next time you spot a mature range, drop a count line across the heaviest congestion. Measure the cause before you trade the breakout.